Grading Bell Curve Calculator: Z-Score, Percentile and Grade
GradesCompare a score with class average and standard deviation.
This bell curve grade calculator converts your raw score into a curved letter grade by comparing you to your class. Enter your score, the class average, and the standard deviation, and it computes your z-score, your percentile on the normal distribution, and the letter grade that percentile earns — the same math instructors use when they grade on a curve.
How the Grading Bell Curve Calculator Works
Bell-curve grading rests on one big idea: your grade should reflect how you performed relative to your class, not against a fixed percentage. The Grading Bell Curve Calculator takes three numbers — your raw score, the class average (the mean), and the standard deviation — and runs them through the mathematics of the normal distribution to tell you exactly where you land.
The engine has two stages. First it computes a z-score, which measures how many standard deviations your score sits above or below the mean. Then it feeds that z-score into the normal cumulative distribution function (normal CDF) to produce a percentile — the share of the class expected to score at or below you. Finally, it maps that percentile onto a letter grade using standard percentile bands.

Inputs: (1) your student score, (2) the class mean, and (3) the standard deviation of the class scores. Outputs: your z-score, your percentile rank, and a suggested curve grade (A–F). The calculator assumes scores follow an approximately normal — bell-shaped — distribution, which is the same assumption instructors make when they “grade on the curve.”
The Percentile-to-Letter-Grade Scale
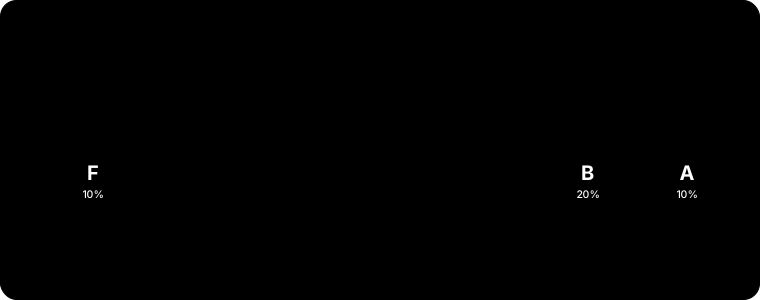
There is no single legally “official” bell curve — each instructor sets their own bands — but one convention appears again and again in textbooks and course policies. It gives the top slice of the class an A, a broad middle a C, and symmetric tails for the extremes. The table below shows this typical mapping, along with the approximate z-score range for each band.
Notice the symmetry: a C sits squarely around the mean, a B and a D sit roughly one standard deviation out, and an A or an F lands in the outer tails. This is the classic “10–20–40–20–10” distribution many people picture when they hear grading on a curve.
| Letter grade | Percentile band | Approx. z-score | Share of class |
|---|---|---|---|
| A | 90th percentile and above | z ≥ +1.28 | Top 10% |
| B | 70th to 90th percentile | +0.52 to +1.28 | Next 20% |
| C | 30th to 70th percentile | −0.52 to +0.52 | Middle 40% |
| D | 10th to 30th percentile | −1.28 to −0.52 | Next 20% |
| F | Below the 10th percentile | z < −1.28 | Bottom 10% |
The Statistics Behind the Curve: Z-Scores and Percentiles
The heart of the calculation is the z-score formula, which standardizes any raw score onto a common scale:
z = (score − mean) ÷ standard deviation
A z-score of 0 means you scored exactly at the class average. A positive z-score means you beat the average; a negative one means you fell below it. Because the normal distribution is fixed and well understood, every z-score corresponds to an exact percentile. The famous 68–95–99.7 rule captures this: about 68% of scores fall within ±1 standard deviation of the mean, about 95% within ±2, and about 99.7% within ±3.
Worked example. Suppose you scored 82, the class mean was 75, and the standard deviation was 8. First compute the z-score: z = (82 − 75) ÷ 8 = 7 ÷ 8 = 0.875. Feeding z = 0.875 into the normal CDF gives a percentile of roughly 81% — you outperformed about four out of five classmates. Checking the table above, the 81st percentile sits in the 70–90 band, so your curve grade is a B. Had the standard deviation been larger, say 15, the same 82 would produce z = 0.47, a percentile near 68%, and possibly a high C — showing how the spread of the class, not just the average, decides your grade.
This is why the bell curve grade calculator can rank an 82 above an 88 from a different class: what matters is your distance from the mean measured in standard deviations, not the raw percentage.


How to Use the Grading Bell Curve Calculator
You only need three numbers, and your instructor or your test statistics usually provide all of them.
- Enter your student score — the raw points or percentage you earned on the exam.
- Enter the class average (mean). If you only have a list of scores, add them up and divide by the number of students.
- Enter the standard deviation of the class scores, which measures how spread out the results are.
- Read your z-score and percentile. The z-score tells you how many standard deviations you are from the mean; the percentile tells you the share of the class you outscored.
- Check the suggested letter grade against the percentile band table, and compare it with your instructor’s actual curve if they published one.
Curving to a Bell vs. Adding Points, and the Criticisms
“Curving” can mean two very different things. Adding points (a flat or linear adjustment) simply raises everyone’s score — for instance, adding the gap between the top score and 100 to every student. It never changes anyone’s rank and never lowers a grade. Our Grade Curve Calculator handles those additive and linear methods.
True bell-curve grading, by contrast, forces the results into a predetermined shape. It converts scores to percentiles and hands out letters by band, which means a fixed fraction of the class receives each grade regardless of the raw numbers. That property is exactly why the method is powerful and why it is controversial.

| Advantages | Criticisms |
|---|---|
| Corrects for an unusually hard or easy exam by judging students relative to peers | Caps the number of A’s — strong students can be pushed down by a strong cohort |
| Standardizes results across different sections or years using z-scores | Assumes scores are normally distributed, which is often false for small classes |
| Reduces the impact of one poorly written question on absolute scores | Creates competition rather than collaboration among classmates |
| Produces a predictable, comparable grade distribution | Can unfairly penalize a high-achieving group or reward a weak one |
Practical Tips for Reading a Curve
Keep a few things in mind so the numbers do not mislead you. First, a curve needs a reasonable class size — percentiles from a class of eight students are noisy and the normal distribution assumption barely holds. Second, always ask your instructor which bands they actually use; some cap A’s at 15% and give almost no F’s. Third, remember that a curve changes your letter grade but the GPA impact still depends on your school’s grading scale and course weight — you can convert your final letters with our VT GPA Calculator.

- The class size is large enough for percentiles to be meaningful (roughly 20+ students).
- You are using the true class standard deviation, not just the range.
- Your instructor published which percentile bands map to which letters.
- The exam scores really are roughly bell-shaped, with no big cluster at the top or bottom.
- You know whether the course adds points or applies a genuine bell curve.
Related Grade & GPA Calculators
Explore the full toolkit of grade & curve calculators to plan your term. Compare additive and linear methods with the Grade Curve Calculator, convert your letters into a cumulative average with our GPA calculators, and estimate standardized-exam outcomes using the AP score calculators. For deeper study strategies, browse our study guides.
For the underlying theory, the UC Davis Chemistry LibreTexts explanation of grading on a curve walks through the standard-deviation method, and this normal-curve grading tutorial demonstrates the z-score-to-grade calculation with real data.
Frequently Asked Questions
What is a bell curve grade calculator?
A bell curve grade calculator converts your raw score into a curved letter grade by comparing you to your class. You enter your score, the class mean, and the standard deviation; it computes your z-score and percentile using the normal distribution, then assigns a grade from the matching percentile band.
Can I use this to curve a test or exam to scaled scores?
Yes. Enter a raw test or exam score with the class mean and standard deviation, and this bell curve calculator returns the scaled score — your z-score, percentile, and curved letter — so it doubles as an exam curve calculator or a scaled-score bell curve tool for any single assessment.
How do you calculate a z-score for grading?
Use z = (score − mean) ÷ standard deviation. Subtract the class average from your score, then divide by the standard deviation. A positive z-score means you scored above average; a z-score of 0 means you hit the mean exactly, placing you at the 50th percentile.
What percentile do you need for an A on a curve?
Under the typical 10–20–40–20–10 distribution, an A goes to roughly the top 10% — about the 90th percentile and above, which corresponds to a z-score near +1.28 or higher. Many instructors widen this to the top 15%, so always check your course policy.
Does grading on a curve always help your grade?
No. A curve helps when the exam was hard and the mean is low, because your score sits farther above the average. But a genuine bell curve can also lower grades in a high-scoring class, since only a fixed fraction can earn each letter regardless of raw percentages.
What is the difference between curving to a bell and adding points?
Adding points raises every score by the same amount and never changes anyone’s rank — nobody’s grade drops. Curving to a bell re-shapes the whole class into set percentile bands, so your grade depends on where you fall relative to classmates, not on a fixed cutoff.
How does standard deviation affect my curved grade?
The standard deviation sets the width of the curve. A small standard deviation means scores are tightly clustered, so even a few points above the mean can push you to a high percentile. A large standard deviation spreads scores out, so the same raw lead over the mean earns a lower percentile.
Does a curved grade change my GPA?
The curve determines your letter grade; your GPA then depends on your school’s grading scale and the course’s credit weight. Convert the curved letter into grade points with a GPA calculator to see the effect on your cumulative average.
Is bell-curve grading fair?
It is debated. Supporters say it corrects for badly calibrated exams and standardizes results across sections. Critics argue it assumes a normal distribution that small classes rarely follow, caps the number of top grades, and turns classmates into competitors rather than collaborators.