Grade Curve Calculator: Compare 5 Ways to Curve Exam Grades
GradesAdd curve points to a raw score and see the curved percentage and letter grade.
A grade curve calculator converts a raw test score into an adjusted percentage and letter grade using a chosen curving rule. This tool runs five methods at once — flat points, top–score–to–100, ratio/linear scaling, the square root curve, and a percentage multiplier — so you can compare every outcome for the same score in one place.
How the Grade Curve Calculator Works
Curving is really just a rule for turning a raw score into an adjusted percentage — and different rules move grades in very different ways. This tool lets you compare five of the most common curving methods side by side, so you can see exactly how each one would treat a given score before you commit to it.
You enter the numbers from a single test or the whole class, and each method returns an independent result. That makes it easy to answer questions like “How much would a flat +7 help versus a square–root curve?” without doing the arithmetic five times by hand.
Inputs: raw score, maximum possible score, curve points (for the flat method), highest class score (for the top–to–100 and ratio methods), and a percent multiplier (for the multiplier method). Outputs: for every method the calculator returns the curved percentage and the matching letter grade on the standard A–F scale, so you can compare all five approaches in one view.
The Five Curving Methods, Compared
Each method starts from the same raw score but reshapes the distribution differently. Some add a fixed cushion to everyone, some stretch the scale so the top student anchors 100, and one compresses the bottom of the range to rescue failing scores. The table shows the exact formula behind each option in the grade curve calculator.

| Method | Formula | What it does | Best when |
|---|---|---|---|
| Flat points | curved % = raw % + N | Adds the same N points to every score; preserves rankings and gaps | A few questions were unfair or the whole test ran hard |
| Top score to 100 | curved % = raw % + (100 − highest %) | Shifts everyone up by the top scorer’s gap to 100 | The best student clearly mastered the material but fell short of 100 |
| Ratio / linear scale | curved % = (raw ÷ highest) × 100 | Rescales so the top score becomes 100; lower scores rise proportionally | You want the highest score to define the ceiling |
| Square root curve | curved % = 10 × √(raw %) | Boosts low scores most, high scores least | Many students failed and you want to compress the bottom |
| Percentage multiplier | curved % = raw % × factor | Multiplies every percent by a chosen factor (e.g. 1.10) | You want a simple, tunable across–the–board bump |
A Worked Example: One Score, Five Curves
Suppose a student earns a raw score of 68 out of a maximum of 100, giving a raw percentage of 68% (a D+). The highest class score was 85%. Here is how each method transforms that single 68.
Flat points (+5): 68 + 5 = 73% → C. Everyone gains five points, so rankings and the spacing between students stay exactly the same.
Top score to 100: the gap is 100 − 85 = 15, so 68 + 15 = 83% → B. This is generous because the top scorer’s shortfall becomes everyone’s bonus.
Ratio / linear: 68 ÷ 85 × 100 = 80% → B−. The top score is stretched to 100 and every score rises in proportion.
Square root curve: 10 × √68 ≈ 10 × 8.25 = 82.5% → B−. Notice a 90% would only become about 94.9% under this rule — low scores gain far more than high ones.
Percentage multiplier (×1.10): 68 × 1.10 = 74.8% → C. A modest, predictable lift that scales with each score.
The same 68 lands anywhere from a C to a B depending on the rule — which is exactly why comparing methods before you publish grades matters.

How to Use the Grade Curve Calculator
Enter what you know and read across the results. You do not need to fill every field — a method only needs its own inputs.

- Enter the raw score and the maximum possible score for the test to establish the base percentage.
- For the flat method, type the number of curve points you want to add to every student.
- For the top–to–100 and ratio methods, enter the highest class score so the tool knows the current ceiling.
- For the multiplier method, enter the percent multiplier (for example, 1.05 for a 5% boost).
- Read each method’s curved percentage and letter grade, then pick the approach that fits your goal and grading policy.
The Standard US Letter-Grade Scale
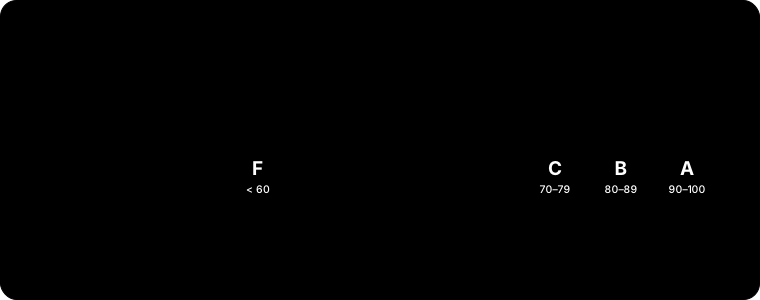
A curve only matters once you map the curved percentage back to a letter grade. Most US schools use the standard scale below, though exact cutoffs vary by district and institution — always defer to your own syllabus or student handbook. Treat these as the typical ranges, not a universal law.
| Letter grade | Percentage | GPA (4.0 scale) |
|---|---|---|
| A+ | 97–100% | 4.0 |
| A | 93–96% | 4.0 |
| A− | 90–92% | 3.7 |
| B+ | 87–89% | 3.3 |
| B | 83–86% | 3.0 |
| B− | 80–82% | 2.7 |
| C+ | 77–79% | 2.3 |
| C | 73–76% | 2.0 |
| C− | 70–72% | 1.7 |
| D+ | 67–69% | 1.3 |
| D | 63–66% | 1.0 |
| D− | 60–62% | 0.7 |
| F | Below 60% | 0.0 |
Why Teachers Curve — and When Not To
Teachers curve to correct for problems in the test, not to inflate grades for their own sake. If a question was ambiguous, the material was harder than intended, or the whole class clusters far below the expected average, a curve realigns scores with true understanding. It can also fit results to an expected distribution using the class mean and standard deviation — the logic behind a true bell curve or percentile–based system.
But curving has trade–offs worth weighing before you apply one.

| Pros of curving | Cons of curving |
|---|---|
| Corrects for an unfair or overly hard exam | Can mask gaps in learning that need attention |
| Keeps a fair grade distribution across sections | Norm–referenced curves make students compete with peers |
| Rescues a class that clustered too low | A generous curve can inflate grades and mislead |
| Transparent formulas are easy to explain | Different methods produce very different results for the same score |
- The problem is with the test, not with a single student’s effort
- The method matches your goal (rescue low scores vs. reward the top)
- The curve is applied to every student under the same rule
- Curved grades still respect your school’s grading policy
- You can explain the formula to students and parents
Related Grade & GPA Calculators
Explore more tools to plan, curve, and convert your grades:
Grading Bell Curve Calculator for a statistics–based curve using the mean and standard deviation.
Grade & curve calculators for the full set of curving tools.
GPA Calculator and the wider GPA calculators to turn letter grades into a grade–point average.
AP score calculators and our study guides for exam prep and grading explainers.
Sources
Letter–grade and GPA conventions verified against Academic grading in the United States (Wikipedia) and institutional grading policy from the Baruch College (CUNY) grading catalog.
Frequently Asked Questions
What is a grade curve calculator?
It is a tool that applies a curving formula to a raw score and returns the adjusted percentage and letter grade. This calculator shows five different methods side by side so you can compare how each rule — from a simple flat bonus to a square root curve — would change the result.
Is a Texas curve the same as a square root curve?
Yes. A Texas curve is just another name for the square root curve, so this calculator handles both with one formula: curved % = 10 × √(raw %). A 49% becomes 70% and an 81% becomes 90%, giving the lowest scores the biggest lift while never producing a result above 100. It is popular in tough science and math courses.
How does the square root curve work?
You take the square root of the raw percentage and multiply by 10, so curved % = 10 × √(raw %). A 49% becomes 70% while a 90% becomes about 94.9%. It boosts low scores far more than high ones, which is why it is popular when much of the class struggled.
What is the difference between a flat curve and a linear scale?
A flat curve adds the same number of points to everyone, preserving the exact gaps between students. A linear (ratio) scale divides each score by the highest score and multiplies by 100, so the top scorer becomes 100% and everyone rises in proportion — a bigger lift for lower scores.
Does curving always raise grades?
With these five methods, effectively yes — each is designed to lift or hold scores, never lower them. A pure norm–referenced bell curve based on the mean and standard deviation can in theory lower some grades, but the methods in this tool only shift scores upward or leave them unchanged.
What percentage is each letter grade?
On the typical US scale, A is 90–100%, B is 80–89%, C is 70–79%, D is 60–69%, and F is below 60%, with plus/minus cutoffs subdividing each band. Exact thresholds vary by school, so check your syllabus.
Which curving method is the fairest?
There is no single fairest method — it depends on your goal. Flat points preserve rankings and are easy to justify; the square root curve helps struggling students most; ratio scaling rewards the top performer. Comparing all five before you decide is the point of this tool.
How do I convert a curved percentage to GPA?
Map the curved percentage to a letter grade, then to grade points: A = 4.0, B = 3.0, C = 2.0, D = 1.0, F = 0.0, with plus/minus values in between. Use our GPA Calculator to average multiple courses.
What is the top-score-to-100 method?
It finds the gap between the highest class score and 100, then adds that same gap to every student. If the top score was 85%, everyone gains 15 points. It is the most generous of the linear methods because one student’s shortfall becomes the whole class’s bonus.